More often, the failure occurs in translation: a floating-point voxel value becomes an image without its units, a derived series loses its relationship to the source acquisition, or a viewer displays a visually convincing color overlay that cannot support a defensible measurement.
This is the central challenge in PACS DICOM integration for quantitative MRI. A map must arrive not merely as pixels, but as an interpretable clinical object with provenance, units, scaling, spatial registration, and a predictable place in the radiologist’s workflow. Consider the implications: the difference between a useful parametric map and an attractive but unreliable picture is often determined by the integration layer rather than by the reconstruction algorithm.
A quantitative map is not simply another MRI series
Conventional MRI images are usually interpreted primarily through signal intensity and anatomical context. Quantitative maps add another layer: each voxel is intended to represent a physical or biologically meaningful value, such as an apparent diffusion coefficient, a T1 or T2 relaxation estimate, cerebral blood flow, cerebral blood volume, or a pharmacokinetic parameter such as Ktrans in dynamic contrast-enhanced MRI.
That value has meaning only when several pieces of information travel with it:
- the unit in which the measurement is expressed;
- the relationship between the stored pixel value and the physical value;
- the acquisition and processing parameters used to derive the map;
- the source images and series from which it was calculated;
- the spatial orientation, voxel dimensions, and frame of reference;
- the software version, algorithm, and relevant quality indicators;
- the identity and status of the patient data after de-identification or correction.
If any of these are missing, the image may still open in a viewer, but the clinical interpretation becomes fragile. A map that appears to show elevated diffusivity may in fact be showing a scaled integer representation, a clipped range, or a misregistered overlay. The viewer may render it with a color bar, but the color bar is not a substitute for a preserved measurement model.
The DICOM standard provides a more appropriate foundation than treating these outputs as ordinary screenshots. DICOM Supplement 172 introduced the Parametric Map Storage SOP Class, with the UID 1.2.840.10008.5.1.4.1.1.30, to support quantitative maps derived from multi-parametric imaging. The object is designed for pixel values represented as floating-point or integer data, together with the information required to interpret those values in physical units.
This is particularly important for diffusion MRI, where the distinction between an ADC value and a display intensity is clinically consequential. It is equally relevant to perfusion maps, susceptibility-derived measurements, myelin-sensitive contrasts, and research workflows that may eventually become part of longitudinal clinical assessment.
A quantitative MRI map is clinically meaningful only when its number, unit, origin, and spatial context remain connected from reconstruction to reporting.
The integration path begins before the PACS
In practice, teams often begin with the destination: which PACS accepts the derived series, which port should receive it, or whether a cloud viewer can display the output. That is understandable, but it reverses the order in which the problem should be solved.
The first question is what the map represents and how it will be used. A research map intended for cohort analysis has different requirements from a map that will influence a radiologist’s treatment-planning report. The former may prioritize batch export, reproducible processing, and access to raw or intermediate data. The latter requires clear presentation, stable identifiers, reviewable provenance, and a workflow that does not force the clinician to leave the primary imaging environment.
A sensible integration design traces the map through five linked stages:
1. Acquisition — the original MRI series are collected from the scanner, modality gateway, or imaging archive.
2. Processing — a local or cloud-based pipeline calculates the quantitative output, potentially including denoising, motion correction, distortion correction, registration, segmentation, and model fitting.
3. Encoding — the result is converted into a DICOM-compliant object with suitable metadata, units, references, and pixel representation.
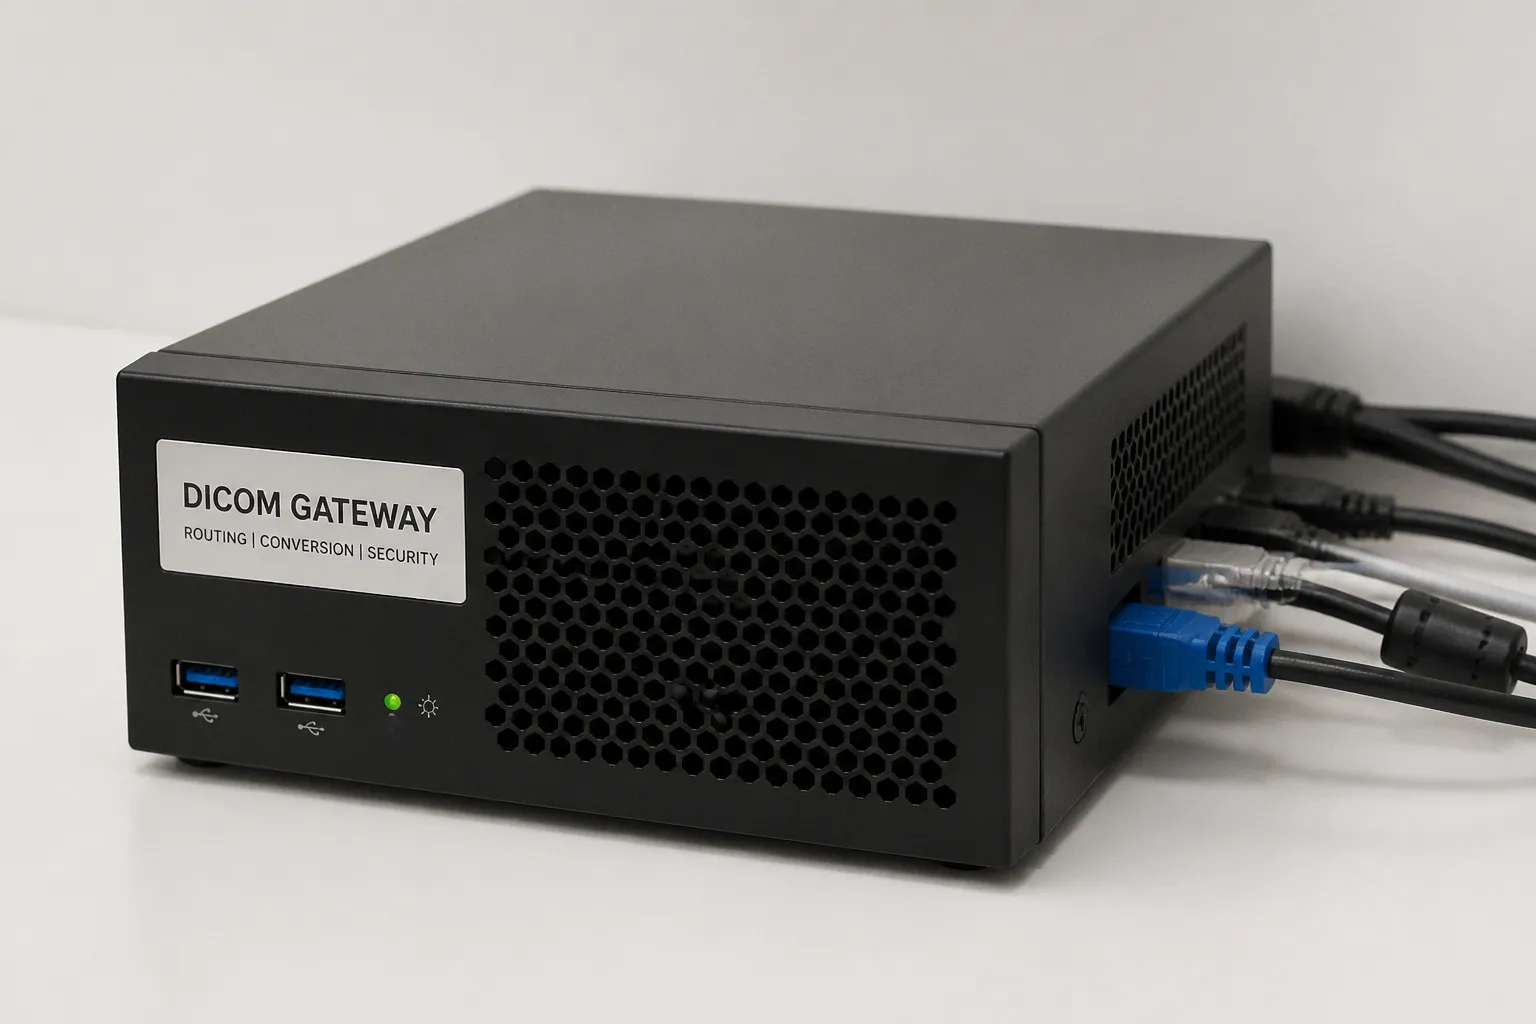
4. Routing — a gateway, orchestration service, or DICOM router sends the derived object back to the appropriate patient and study context.
5. Interpretation — the PACS or enterprise viewer presents the map alongside the source images, measurements, structured results, and radiology report.
The integration can break at each boundary. A processing service may receive only part of a multi-series examination. A cloud pipeline may return the result under a new accession number. A DICOM router may accept the object but route it into a generic research destination. A PACS may store a valid Parametric Map object but fail to render it because its workstation does not support the relevant floating-point representation or Real World Value Mapping.
This shift allows us to see PACS integration as a chain of clinical meaning rather than a simple transfer of files.
Identifying the source study reliably
The derived map should remain traceable to the source examination. In a radiology department, this usually means preserving the appropriate patient, study, series, and instance relationships rather than generating a visually similar image with a new and ambiguous identity.
At minimum, the workflow should define how the processing service handles:
- Patient ID and accession number;
- Study Instance UID and source Series Instance UID;
- acquisition and reconstruction series;
- multiple exams performed on the same day;
- repeated scans, rescans, and corrected studies;
- anonymized research identifiers;
- failed, partial, or reprocessed outputs.
This is where seemingly minor workflow choices become consequential. If the pipeline is triggered by a folder name or by a loosely matched patient label, a derived series may be associated with the wrong examination. If it relies only on the study date, two scans can become indistinguishable. A robust system uses DICOM identifiers and explicit source references, with reconciliation rules for exceptions.
The same principle applies to longitudinal work. When a quantitative map is intended to follow a patient’s trajectory over time, the value of the analysis depends on more than having several measurements. The acquisition protocol, scanner behavior, processing version, and spatial normalization must be sufficiently stable to distinguish biological change from technical variation.
Choosing the right DICOM representation
The most important architectural decision is how the quantitative output will be represented in DICOM. There is no single object that serves every purpose, and an enterprise workflow often uses more than one.
Parametric Map Storage for voxel-wise measurements
DICOM Parametric Map Storage is the natural object for a voxel-wise quantitative result. It is designed for maps in which pixel values represent measurements rather than display brightness, and it supports integer and floating-point pixel formats.
A parametric map should carry enough information for a receiving system to interpret the values correctly. That includes the measurement units, the relationship between stored values and real-world values, and the source images used in derivation. In a diffusion workflow, for example, the receiving system should be able to distinguish an ADC map from a conventional image series and understand the intended units rather than infer them from the series description.
This distinction matters because a standard viewer may display every DICOM object as an image, while only some objects preserve the semantics required for quantitative analysis. A grayscale or color rendering can be useful for visual review, but it should not be mistaken for a complete representation of the underlying measurement.
Real World Value Mapping for scale and units
Real World Value Mapping, or RWVM, defines the mathematical relationship between stored pixel values and real-world physical units. The mapping can be expressed through a lookup table or linear scaling, and the relevant information includes the Measurement Units Code Sequence (0040,08EA) and Real World Value LUT Data (0040,9212).
In less technical terms, RWVM tells the receiving application what a pixel number means outside the file. A stored value of 120 may not mean the same thing across two maps, and a value that has been compressed into an integer range must not be treated as though it were the original physical measurement. Without the scaling relationship, a viewer can preserve the appearance of a map while silently losing its quantitative meaning.
For developers, this means that pixel data and interpretation metadata must be tested together. For clinical users, it means that a displayed color scale should correspond to the encoded real-world values, not to arbitrary minimum and maximum intensities selected by the workstation.
DICOM Structured Reporting for summaries and measurements
A quantitative workflow often produces results that are not naturally represented as an image. Regional volumes, asymmetry indices, quality flags, mean values within a lesion, or normative comparisons may be better expressed through DICOM Structured Reporting.
Some volumetric analysis platforms export quantitative brain measurements directly as DICOM SR and provide native-space segmentation overlays. This can enable integration with PACS viewers and reporting tools, including environments such as PowerScribe and Syngo.via, when the receiving systems support the relevant objects and presentation behavior.
DICOM SR is valuable because it gives the result a structured form that can be searched, displayed, or incorporated into a report without requiring the radiologist to manually transcribe values from a separate application. It also supports a clearer distinction between the measured result and the visual overlay used to inspect it.
The image and the report should not be forced to do the same job. The map shows spatial distribution. The segmentation or overlay shows where an analysis was performed. The structured report carries the summarized result. A mature workflow keeps these components linked.
Secondary Capture: useful for visibility, weak for quantitation
Secondary Capture images have a legitimate role when broad viewer compatibility is required. A rendered snapshot may help a clinician see a map in a legacy workstation that cannot display a native quantitative object. It can also provide a stable visual record for a presentation or a report.
But Secondary Capture should not be treated as the quantitative source of truth. A rendered image generally does not preserve the full scaling context required to recover the original physical values. The screenshot may show a legend, but that legend does not guarantee machine-readable units, provenance, or reproducible measurements. The color mapping may also vary according to the processing software or display configuration.
A practical enterprise workflow may therefore send both a native Parametric Map object and a compatibility rendering, clearly labeling their purposes. The rendering supports visibility; the native object preserves the measurement.
| Integration object | Primary role | Strength | Limitation |
|---|---|---|---|
| DICOM Parametric Map | Voxel-wise quantitative measurements | Preserves quantitative pixel data and relevant measurement context | Viewer support may be uneven, particularly for floating-point display |
| Real World Value Mapping | Connects stored pixels to physical units | Makes scaling and units explicit | Must be correctly interpreted by the receiving application |
| DICOM SR | Regional values, volumes, indices, and summaries | Supports structured review and reporting | Does not replace the spatial map |
| Segmentation object or overlay | Shows analyzed anatomy or lesion regions | Connects measurements to anatomical location | Requires careful spatial registration and viewer support |
| Secondary Capture | Broad visual compatibility | Opens in many legacy environments | Not a reliable substitute for native quantitative data |
DICOMweb and the movement from file transfer to service integration
Traditional DICOM communication, including C-STORE, remains important in hospital environments. A local gateway can receive the processed result and forward it to a PACS using the same kind of routing infrastructure already used for modality images.
Cloud-based and hybrid deployments increasingly add DICOMweb services:
- QIDO-RS supports queries for studies, series, and instances;
- WADO-RS supports retrieval of DICOM objects;
- STOW-RS supports storing derived objects into a DICOMweb endpoint.
These services do not remove the need for careful data modeling. They change how the objects are requested, transmitted, and orchestrated. A processing pipeline may use QIDO-RS to identify the relevant study, WADO-RS to retrieve source instances, and STOW-RS to return the Parametric Map, segmentation, or DICOM SR. The same workflow may still require a local gateway for identity management, audit logging, and communication with systems that rely on traditional DIMSE services.
The useful distinction is between transport and meaning. DICOMweb can make the transport more flexible, but it cannot repair a missing unit, an incorrect source reference, or an unstable accession-matching rule.
Where HL7 and FHIR enter the workflow
MRI processing is not isolated from the rest of the hospital. The order may originate in an RIS or EHR, the clinical indication may be carried through HL7 v2 messages, and the final result may need to be associated with a report, encounter, or diagnostic service.
HL7 v2 commonly supports the operational messages that connect scheduling, orders, and results in established radiology environments. HL7 FHIR can provide a more service-oriented approach for exchanging healthcare resources and integrating applications with modern clinical systems. The exact division depends on the institution’s architecture, but the principle remains consistent: the imaging object and the clinical order must not become disconnected.
An analysis pipeline should know why a scan was performed, which study it belongs to, and where the result should appear. Otherwise, a technically correct map can become clinically invisible. The radiologist may need to search a second application, reconcile identifiers manually, or wait for an asynchronous result that has no obvious relationship to the original order.
This is not a minor usability problem. Every additional reconciliation step introduces time, uncertainty, and the possibility that a subtle abnormality will be overlooked simply because the result is not where the clinician expects it to be.
Designing for radiology workflow rather than algorithm demonstration
A research demonstration often succeeds when an expert can find the output and understand it after a few minutes of exploration. Clinical workflow has a different standard. The result must arrive at the right point in the examination, with minimal interruption, and with enough context to support a decision made under time pressure.
Radiology workflow optimization for quantitative MRI therefore includes several practical questions:
- Does the derived series appear under the original study or in a separate destination?
- Is the series description specific enough to distinguish ADC, perfusion, segmentation, and quality-control outputs?
- Are source images available beside the map?
- Can the reader inspect a voxel value and its unit?
- Can the reader compare current and prior examinations?
- Are failed analyses clearly marked rather than silently omitted?
- Does the system prevent an outdated reprocessing result from appearing as the latest clinical output?
- Can structured measurements be copied into the report without manual transcription?
- Are research-only outputs separated from clinically validated outputs?
The answer should be designed around the radiologist’s existing mental model. A new map should not arrive as an unexplained series with a generic name such as “processed image.” Its label should communicate the measurement, processing context, and, where relevant, the anatomical target.
The same applies to segmentation. A native-space overlay can be clinically useful because it allows the reader to inspect whether the mask follows the intended anatomy. A normalized-space result may be valuable for group analysis but less suitable for direct clinical review if the transformation is not transparent. For longitudinal interpretation, both views may matter: native-space results preserve the patient’s anatomy, while standardized comparisons can support trajectory-level analysis.
Consider the implications for cognitive reserve and subtle degradation. A small change in a regional volume or diffusion metric may matter over time, but only if it can be distinguished from differences in scanner protocol, registration, segmentation version, or display scaling. Integration is therefore part of measurement validity.
Cloud deployment, security, and the boundary of trust
Cloud-based MRI analysis can reduce local infrastructure requirements and make advanced processing available across multiple sites. It can also introduce a longer chain of custody for protected health information, source image retrieval, derived results, and user access.
The technical design should define where identifiable data are converted to research identifiers, where de-identification occurs, and which system retains the mapping between identities. De-identification is not limited to removing a patient name from the header. It may require handling private tags, embedded identifiers, dates, accession information, and image content that could contain identifying text.
A cloud workflow also needs a clear answer to a deceptively simple question: which system is authoritative? If the cloud service stores a processed result, the PACS stores a returned object, and the local gateway retains a temporary copy, the institution should know which version is clinically valid and how corrections are propagated.
Security and interoperability are intertwined here. Authentication, authorization, encryption, audit trails, and network segmentation protect the data, but they also affect whether the workflow remains usable. A system that requires a separate login for every derived result may be secure in theory and unusable in practice. A system that grants broad access to an entire research bucket may be convenient and clinically inappropriate.
For enterprise imaging platforms, a durable design usually includes:
- role-based access that separates clinical, research, and administrative permissions;
- auditable retrieval and storage events;
- controlled retention of temporary processing data;
- explicit handling of failed jobs and partial uploads;
- versioning of algorithms and processing configuration;
- a documented process for correcting or withdrawing a derived result;
- consistent identity management across PACS, RIS, EHR, gateway, and cloud services.
This is especially important when a quantitative map may influence a longitudinal decision. A clinician should be able to understand not only what the current value is, but which software and processing pathway produced it.
The safest quantitative workflow is not the one with the most sophisticated algorithm; it is the one whose provenance remains legible when the result is clinically questioned.
Validation should follow the entire trajectory of the data
A software team may validate an algorithm against a reference dataset and still encounter serious problems in production. The reason is that clinical integration adds transformations that are not present in the model-development environment.
Validation should therefore cover the entire trajectory from acquisition to display.
Validate the encoded object
Confirm that the produced DICOM object contains the expected SOP Class, source references, orientation, dimensions, frame information, units, and value mapping. Test both integer and floating-point representations where the pipeline uses them. If RWVM is required, verify that the stored values reproduce the intended physical measurements after decoding.
A simple but powerful test is to select known voxels from the processing environment and compare them with the values recovered from the DICOM object. This catches scaling errors that a visual inspection may miss.
Validate routing and identity
Use test studies with repeated examinations, rescans, multiple series, and intentionally incomplete data. Confirm that the output returns to the correct patient and study, that it is not duplicated unexpectedly, and that a failed processing job does not create an apparently valid empty result.
For de-identified research workflows, test the full mapping process rather than only the final anonymized file. The system should demonstrate that identifiers are transformed consistently and that re-identification authority remains restricted.
Validate display and reporting
A valid object can still be clinically unusable if the workstation renders it incorrectly. Test windowing, color scales, units, cursor readouts, overlays, segmentation alignment, and comparison with source images. Confirm that the viewer does not silently convert a quantitative object into a display-only image.
If a DICOM SR is generated, confirm that its measurements appear in the intended viewer or reporting tool and that labels are understandable to the clinical audience. A regional volume should not arrive as an opaque code that requires the reader to consult a separate manual.
Validate longitudinal consistency
For follow-up imaging, compare repeated processing of the same study. The output should be stable within the expected technical tolerance. Then assess how protocol changes, scanner upgrades, field-strength differences, and software updates affect the trajectory.
This does not mean that every quantitative MRI measure must be frozen forever. Algorithms evolve, and improved correction or segmentation can be clinically valuable. But a change in processing version should be visible. Otherwise, an apparent biological shift may actually reflect a software transition.
A practical implementation sequence
The most reliable deployments are usually staged rather than attempted as a single enterprise-wide switch. A focused pilot can expose the difficult parts of the workflow before they become embedded across departments.
A useful sequence is:
1. Define the clinical use case. Specify whether the output is for visual support, structured reporting, treatment planning, research, or longitudinal monitoring. The purpose determines the required object types and validation burden.
2. Inventory the source data. Document the MRI sequences, scanner models, acquisition parameters, missing-series behavior, and expected input identifiers.
3. Choose the canonical output. Decide whether the native result will be a Parametric Map, DICOM SR, segmentation object, or a combination, and reserve Secondary Capture for compatibility rather than quantitation.
4. Map the identifiers. Establish how patient, study, series, accession, order, and research identifiers move through PACS, RIS, EHR, gateway, and processing service.
5. Implement the transport layer. Use C-STORE where it fits the existing environment and DICOMweb services where query, retrieval, and storage APIs improve orchestration.
6. Connect the result to the workflow. Place the derived series and structured measurements where the radiologist already reviews the examination.
7. Test failure states. Include missing source images, interrupted uploads, duplicate jobs, stale results, unsupported viewers, and failed segmentation.
8. Document provenance. Make the processing version, source reference, units, and quality status discoverable to the people who interpret the result.
9. Pilot with clinical feedback. Ask not only whether the map is accurate, but whether it arrives at the right moment, in the right place, with the right explanation.
10. Expand cautiously. Add sites, scanners, and new quantitative contrasts only after the initial pathway is technically and clinically stable.
The temptation is to treat the final display as the visible endpoint and everything before it as infrastructure. In reality, the clinical endpoint is a chain of agreements: what the number means, which anatomy it belongs to, how it was derived, and how confidently it can be compared with earlier or later measurements.
The integration steps that will matter tomorrow
The future of quantitative MRI in the enterprise is unlikely to depend on one universal viewer or one favored processing package. It will depend on whether imaging systems can preserve meaning across vendors, deployment models, and stages of clinical maturity.
DICOM Parametric Map Storage provides a foundation for native quantitative maps. RWVM preserves the relationship between encoded values and physical units. DICOM SR makes regional measurements and summaries more accessible to reporting workflows. DICOMweb offers a service-oriented transport layer, while HL7 v2 and FHIR connect imaging activity with orders, encounters, and results.
None of these standards eliminates implementation work. They give the work a stable vocabulary.
For organizations planning a quantitative MRI PACS workflow, the most important decision is to define the measurement before defining the interface. Once the clinical meaning is clear, the technical choices become easier to evaluate: which object preserves it, which transport moves it, which viewer can display it, and which audit trail allows the team to understand it months later.
That is the quieter promise of enterprise integration. It does not make the scan more dramatic. It makes the result more dependable, more longitudinal, and more connected to the human biology that gave the measurement its purpose in the first place.