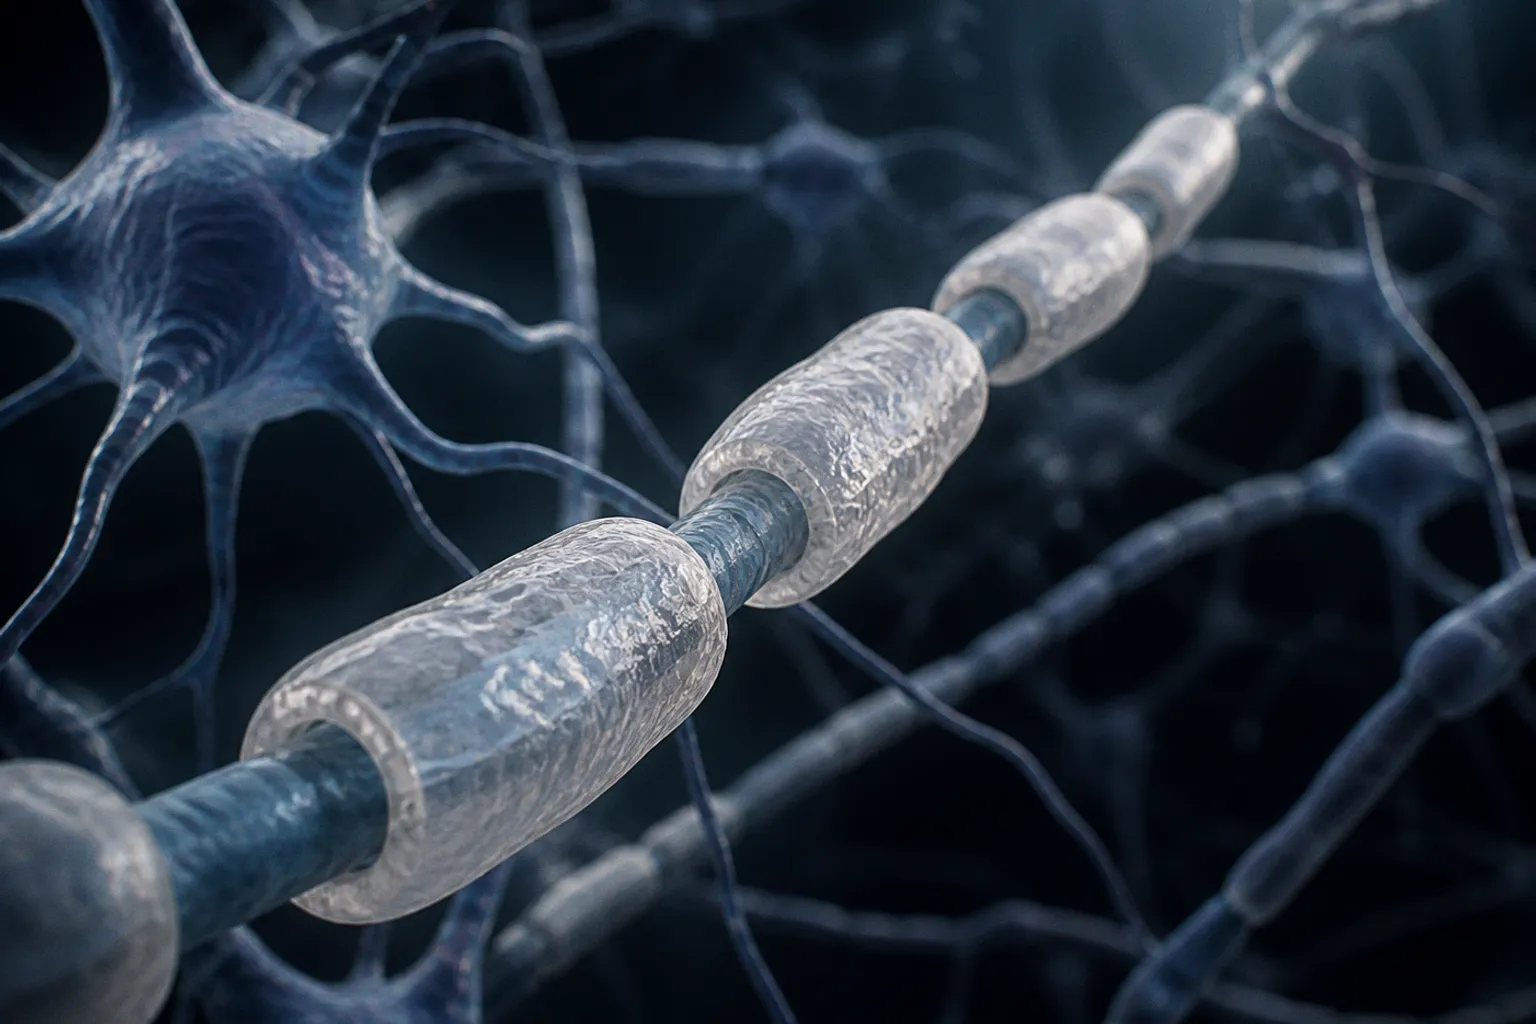
The result is not a diagnostic threshold or a demonstrated causal chain. It is a biological signal with a difficult imaging problem attached: separating altered myelin biology from the many other processes that change with age.
The signal is cellular, but the measurement is indirect
Oligodendrocytes produce myelin. The reported association is therefore relevant to any attempt to interpret age-related white-matter change through MRI. Increased oligodendrocyte density appears alongside lower NRF2 expression and damage to myelinated axons in the study summary.
That combination matters because it does not describe a single clean imaging phenotype. A density increase does not automatically indicate better myelin maintenance. Reduced NRF2 expression introduces a molecular dimension. Axonal damage introduces a structural one. MRI can be used to study the resulting tissue pattern, but the scan itself does not convert directly into a cellular readout.
For neuroimaging software, this is the central constraint. An algorithm may detect altered signal or tissue organization. It cannot, from this evidence alone, label that pattern as oligodendrocyte failure, reduced NRF2 activity, or axonal injury. Those are linked biological features reported across human and mouse data, not interchangeable MRI classes.
Human MRI and mouse models answer different questions
The study’s design combines human MRI data with mouse models. That increases the biological scope of the work, but it also places a hard limit on interpretation.
Human MRI provides an in-vivo view of brain structure and tissue properties in people. Mouse models can support investigation of cellular and molecular mechanisms. The two layers can reinforce a hypothesis. They do not erase the translation gap between an animal model and a human imaging phenotype.
For clinical researchers and developers, the correct response is to preserve that separation in the data model. Imaging-derived features should remain imaging-derived features. Cellular measurements and molecular expression should remain separate evidence channels unless the study explicitly validates a mapping between them.
The available report does not provide acquisition parameters, MRI contrasts, sample sizes, cognitive endpoints, effect sizes, or reconstruction details. It therefore cannot support claims about a particular sequence, biomarker threshold, segmentation method, or classifier performance. Any pipeline built around this finding would need independent validation before treating the reported associations as a usable marker of cognitive decline.
What this changes for analysis
The finding is most useful as a warning against single-feature interpretation. Increased oligodendrocyte density, reduced NRF2 expression, and myelinated-axon damage form a linked but heterogeneous pattern. A robust analysis would need to test whether MRI features track the pattern consistently, rather than assuming that one intensity measure or one white-matter metric captures it.
That distinction also affects longitudinal studies. If cognitive decline is associated with several interacting tissue processes, a model based on one scan-derived variable may yield a deceptively simple result. Repeated imaging, careful harmonization, and biological validation would be necessary before separating progression from normal variation.
The practical conclusion is narrow. This study may help identify mechanisms worth testing for brain aging, but it does not yet turn oligodendrocyte dysfunction into an MRI diagnosis. The mathematics can expose a pattern. It cannot supply the missing causal proof.