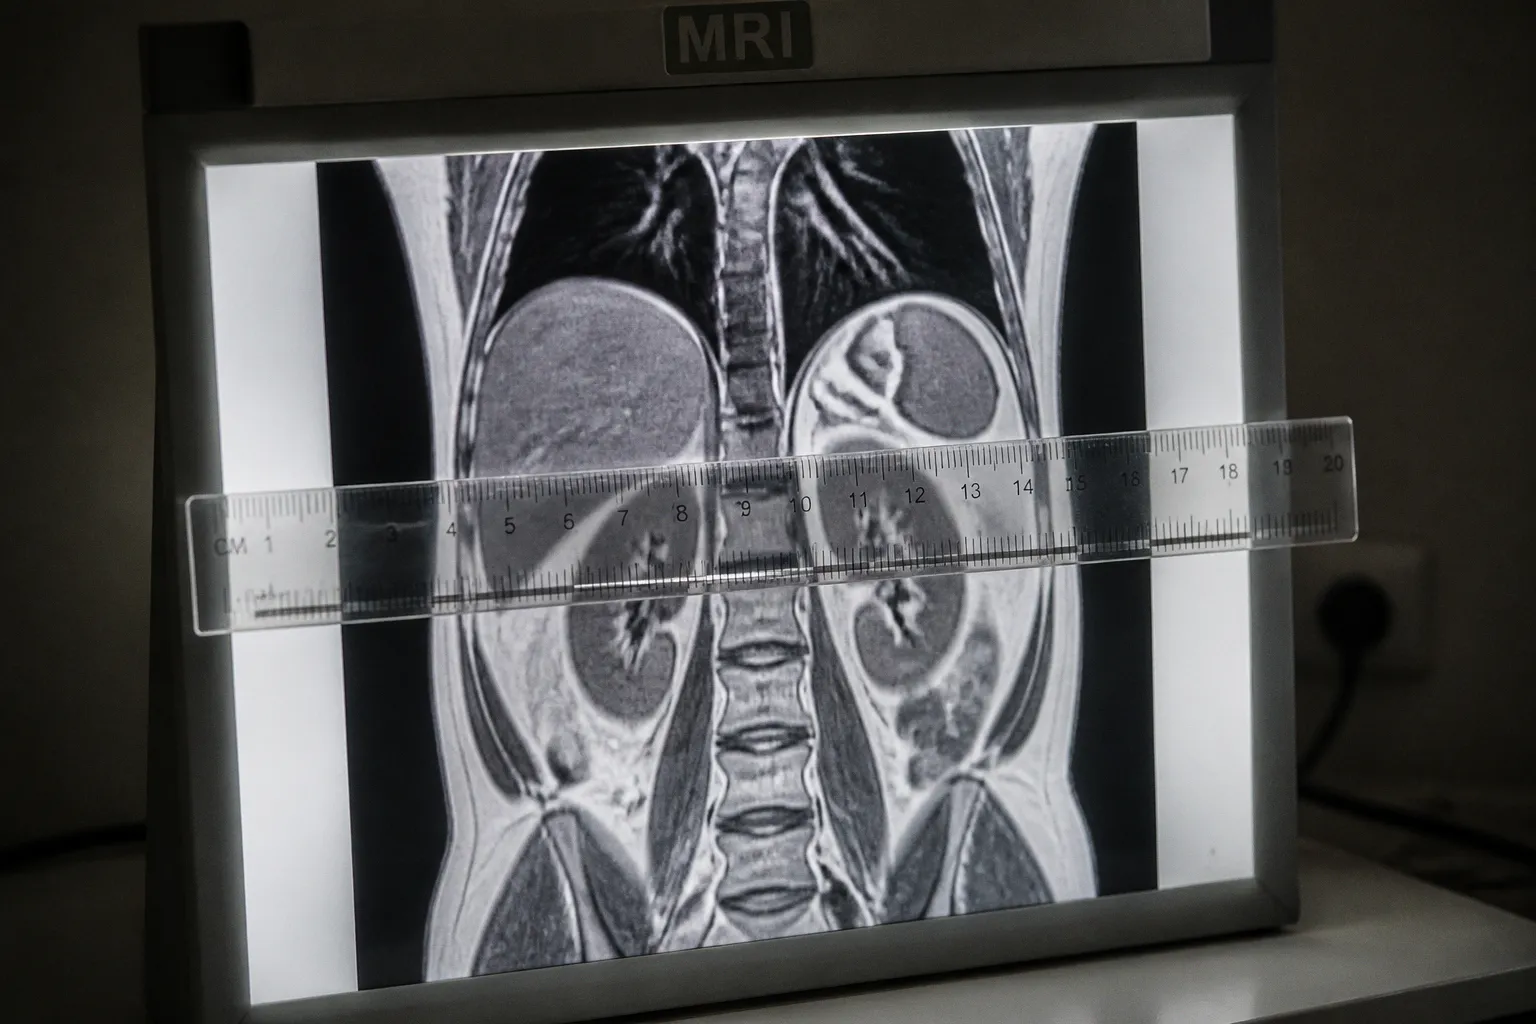
That number, extracted voxel by voxel from a scan of a patient lying still inside a bore, must speak for the biology of a tumour responding to treatment: cells dying, membranes breaking down, water molecules moving more freely through tissue that was once dense and impermeable. The question that quietly haunts every DWI-based oncology protocol, however, is not whether ADC captures real biology — it almost certainly does — but whether the signal we read is stable enough from one scan to the next to justify the decisions we build on it. Repeatability, in this context, is not a technical footnote. It is the very floor upon which clinical meaning stands or collapses.
Consider the implications of a biomarker whose measurement shifts by ten percent on a bad day: that margin could easily swallow the difference between a partial response and stable disease, between escalation and continuation of a regimen that is either failing the patient or, worse, succeeding just enough to be ignored. The literature on ADC repeatability has grown considerably over the past decade, and what it reveals is a nuanced and sometimes uncomfortable picture — one where phantom precision is reassuring, where certain histogram-derived metrics perform well, and where others, particularly thresholded volumetric measures, introduce variability that should give any trialist pause before locking a protocol.
The Precision Gap: Phantom Testing vs. Patient-Level Variability
The starting point for any conversation about ADC measurement quality is the phantom — that carefully constructed object whose diffusion properties are known, stable, and free from the beautiful chaos of living tissue. Multi-centre phantom studies conducted across clinical MRI scanners — spanning both 1.5T and 3T field strengths — have repeatedly demonstrated that ADC can be measured with impressive consistency when the physics are well controlled. In bore-centre configurations, the standard deviation of ice-water ADC measurements sits below two percent, and when the same scanner is used across repeated sessions without any hardware changes, day-to-day repeatability remains within approximately four and a half percent. Within a single examination, the figure tightens further, dropping below one percent.
These numbers are genuinely reassuring, and they form the basis of the Quantitative Imaging Biomarkers Alliance (QIBA) profile for DWI, which exists precisely to standardise how diffusion metrics are acquired, analysed, and reported across sites. The phantom tells us that the hardware and the pulse sequences are capable of extraordinary precision. But the phantom is not the patient.
The moment we move from a controlled ice-water environment to a living human being with a tumour — a person who breathes, shifts, whose blood perfuses and whose bowel gas changes the local field — the measurement story changes fundamentally. In the multicentre ACRIN 6698 trial, which evaluated DWI biomarkers in breast cancer, the within-subject coefficients of variation for tumour mean ADC and for the lower histogram percentiles (the 15th and 25th) remained below eight point one percent. That is a clinically serviceable figure, one that suggests these metrics can distinguish a true biological change from noise — but only if we choose the right metric, and only if we understand what is driving the residual variability.
The phantom tells us the scanner can measure ADC with sub-two-percent precision. The patient reminds us that biology — respiration, perfusion, motion — is where the real repeatability challenge lives.
Performance of Mean and Histogram-Based ADC Metrics
When we speak of ADC in a clinical trial, we are rarely speaking of a single number drawn from a single voxel. More commonly, the protocol defines a region of interest — a tumour segmentation — and from that segmentation a histogram of ADC values is computed, reflecting the heterogeneous cellular landscape within the mass. Some regions are densely cellular with low ADC; others show necrosis or oedema with higher values. The way we summarise that histogram has profound consequences for repeatability.
The ACRIN 6698 experience is instructive here. Mean ADC, the simplest summary statistic, demonstrated within-subject coefficients of variation below eight point one percent, a figure that positions it as a viable endpoint for monitoring treatment response over time. But perhaps more interestingly, the lower percentiles of the ADC histogram — the 15th and 25th percentile values, which represent the most cellular, most diffusion-restricted regions of the tumour — performed comparably to the mean. This matters clinically because those lower percentiles may be more sensitive to early treatment effects: as therapy begins to disrupt the most densely packed tumour compartments, the leftward tail of the ADC histogram should shift first, and a metric that tracks this shift reliably offers a window into response that the mean alone might delay in revealing.
The practical takeaway for trial designers is this: when selecting ADC summary metrics for longitudinal monitoring, mean ADC and the lower histogram percentiles offer a reasonable balance of biological sensitivity and measurement stability. They are not perfect — no imaging biomarker is — but their variability is bounded enough to support meaningful interpretation, provided that acquisition protocols are tightly harmonised across sites and time points.
| ADC Metric | Repeatability (wCV) | Suitability as Endpoint |
|---|---|---|
| Mean ADC | < 8.1% | Reliable for longitudinal monitoring |
| 15th / 25th percentile ADC | < 8.1% | Sensitive to early cellular response |
| Thresholded volumetric ADC | ≥ 3× higher than percentile wCV | Poor — variability may obscure true treatment effect |
The Volumetric Threshold Pitfall in Clinical Endpoints
Here is where the story becomes cautionary. A conceptually appealing approach to ADC-based response assessment is to define a volumetric threshold — say, voxels with ADC below a certain value representing "viable tumour" — and then track how that volume changes over the course of treatment. The idea is intuitive: as therapy works, the volume of restricted-diffusion tissue should shrink. In practice, however, the ACRIN 6698 data showed that ADC-thresholded volumetric metrics demonstrated within-subject coefficients of variation at least three times higher than those observed for percentile-based metrics.
This is a critical finding, and it deserves careful unpacking. The poor repeatability of thresholded volumes is not primarily a failure of the biology; it is a consequence of the mathematics of thresholding applied to noisy, spatially heterogeneous data. When a threshold is applied to a voxel-wise ADC map, small shifts in image registration, segmentation boundaries, or noise characteristics can push large numbers of voxels from one side of the threshold to the other, creating volumetric fluctuations that have nothing to do with tumour biology. The result is a metric that appears to offer granular, spatially resolved information but delivers, in practice, a signal-to-noise ratio that may be inadequate for distinguishing genuine treatment response from measurement artefact.
This shift allows us to appreciate why QIBA and similar standardisation bodies have been cautious about endorsing volumetric ADC endpoints without further validation. It is not that volumetric approaches are inherently flawed — in the right context, with extremely tight protocol control and validated segmentation methods, they may eventually prove their worth. But as of the available evidence, the repeatability data do not support their use as primary endpoints in multi-centre oncology trials where scanner variability and inter-observer segmentation differences compound the inherent measurement noise.
Thresholded ADC volumes can shift by three times the variability of histogram percentiles — a margin large enough to turn a non-responder into an apparent responder, or vice versa.
Gradient Non-Linearity and Multi-Centre Measurement Bias
There is a less visible but equally consequential source of ADC variability that deserves attention: gradient non-linearity. Clinical MRI scanners are engineered to produce spatially uniform gradient fields across the imaging volume, but in practice, gradient performance degrades toward the periphery of the bore. For ADC calculations, which depend on the precise knowledge of the applied diffusion-sensitising gradient amplitude and direction, this degradation introduces a spatially dependent bias.
Multi-centre phantom data have shown that off-centre ADC measurement variability can exceed ten percent — a figure driven by differences in gradient coil design, vendor-specific implementations of diffusion encoding, and the geometric position of the tumour within the bore. A lesion situated anteriorly in the breast, for instance, may be far enough from the bore centre to experience meaningfully different gradient performance than a posteriorly located mass, even on the same scanner. Across different vendors and field strengths, these effects can compound, creating systematic biases that masquerade as biological differences between sites.
For trialists designing multi-centre DWI protocols, gradient non-linearity correction — whether through vendor-provided gradient distortion correction algorithms or through site-specific phantom calibration — is not optional. It is a prerequisite for any claim that ADC differences between sites, or between time points acquired on different systems, reflect biology rather than physics. The DICOM header of a diffusion-weighted image contains the nominal gradient parameters, but nominal is not the same as actual, and the gap between them is where ten percent biases hide.
Several practical steps can mitigate this risk:
1. Acquire diffusion phantoms at each site at study initiation and at regular intervals thereafter, measuring ADC at both bore centre and known off-centre positions to quantify site-specific gradient bias.
2. Apply gradient non-linearity correction as a standard post-processing step, ideally using vendor-supplied correction maps validated against phantom reference values.
3. Restrict the imaging field of view to minimise the inclusion of voxels far from the gradient isocentre where distortion is greatest.
4. Standardise patient positioning protocols across sites so that the anatomical region of interest occupies a consistent position within the bore.
5. Report uncorrected and corrected ADC values in trial data sets to allow post-hoc assessment of gradient correction effectiveness.
These measures do not eliminate gradient-related variability, but they bound it — and bounding variability is precisely what transforms ADC from a promising research metric into a defensible clinical trial endpoint.
Defining Clinically Meaningful Response in DWI Biomarkers
The most challenging question in ADC-based trial design is not how to measure the biomarker; it is how to interpret the measurement. What magnitude of ADC change constitutes a real treatment response, and what falls within the expected test-retest variability of the measurement itself? This question — the minimal clinically important difference, or MCID — remains unresolved across cancer types, and the absence of a universal threshold is one of the most significant gaps in the DWI biomarker literature.
The available data offer guardrails but not a definitive answer. If the within-subject coefficient of variation for mean ADC is approximately eight percent, then any claimed response must exceed that variability to be interpretable — but by how much? A change of ten percent might be statistically distinguishable from noise in a well-powered study, but whether it reflects meaningful tumour biology depends on the cancer type, the treatment mechanism, and the time point of assessment. In some settings, a modest ADC increase may precede radiographic response by weeks; in others, it may simply reflect treatment-related oedema rather than genuine cell kill.
What is needed — and what the field is slowly working toward — is a body of evidence linking specific ADC changes to downstream clinical outcomes: progression-free survival, overall survival, pathological complete response. Without that linkage, ADC remains a biologically plausible but incompletely validated surrogate, valuable for early signal detection in phase I and II trials but insufficient, on current evidence, to serve as a registrational endpoint in phase III.
The ACRIN 6698 experience offers a model for how such validation should proceed: prospective, multi-centre, with pre-specified analysis of repeatability metrics alongside clinical outcomes, and with explicit comparison of candidate ADC summary statistics. Until that model is replicated across tumour types and treatment modalities, the most responsible use of ADC in oncology trials is as a complementary endpoint — informative, biologically grounded, but interpreted with the humility that measurement science demands.
ADC can tell us that tissue is changing. Whether that change means the patient is winning — that answer requires evidence we are still assembling, one well-designed trial at a time.