How it works

Intro

Our vision is to provide a software that is easy to use but still very powerful and flexible. We let the user build image processing pipelines by combining predefined operations performing e.g. segmentations, registrations, deformations, filtering, mathematical functions, or modality-specific operations for MR, PET, CT, radiotherapy. The user can also insert scripts written in MATLAB
or Python anywhere in the pipeline. All this is achieved through an intuitive visual programming concept, where the result from each step can be reviewed to quickly find optimal settings and strategies for every task.

Image data

MICE Toolkit supports import and export of images in many file formats, including DICOM, NIfTI and MHD, as well as conventional image formats such as png, animated GIF files and STL files for 3D printing applications. DICOM and NIfTI files can be imported and structured in one or several databases with flexible tools for database handling. MICE Toolkit also supports importing and exporting DICOM RT Structures and importing DICOM RT Dose for radiotherapy

applications.

Building a workflow

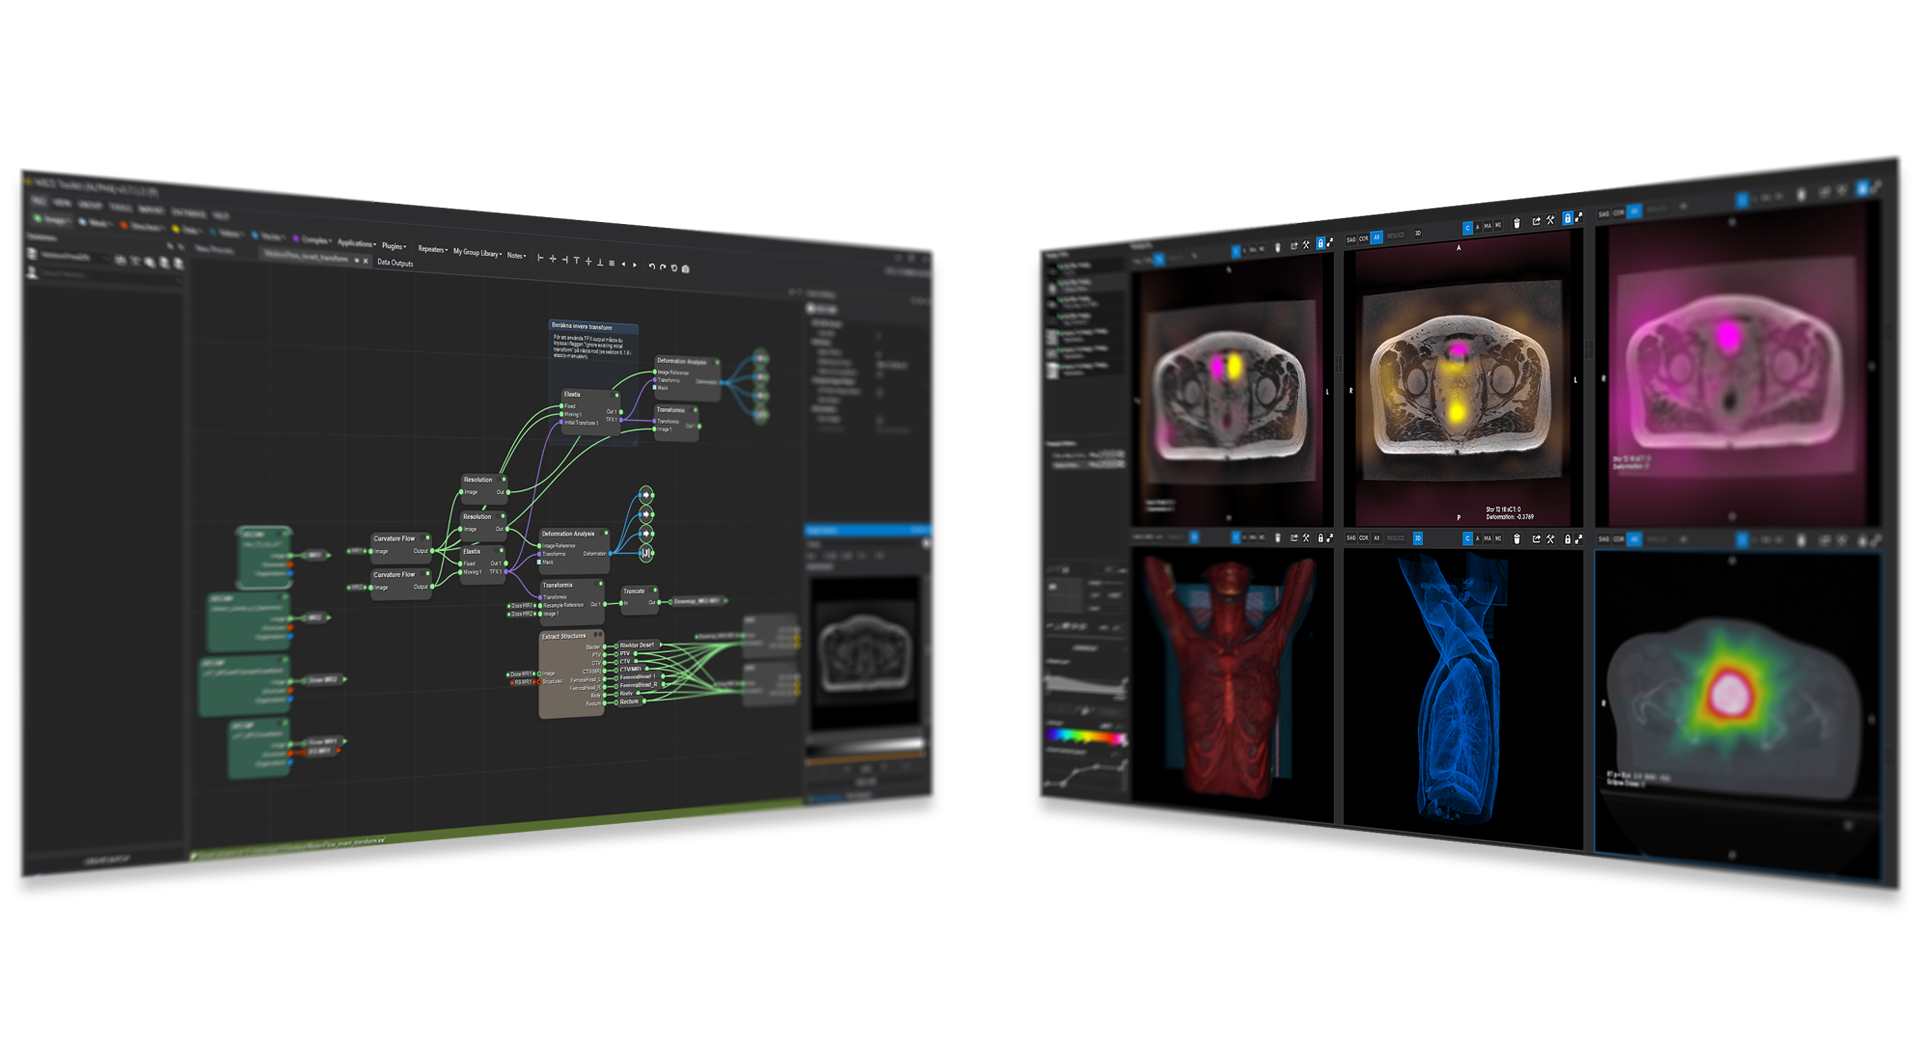
Visual programming is the core of MICE Toolkit. Hundreds of functions (we call them nodes) are available and can be combined to create highly complex pipelines without losing overview or control. Each node can have one or several inputs and outputs, and data types are color coded to simplify the creation of workflows, give a better overview, and reduce the risk for errors. The workflow can be executed at any time in the design process, and the result of each node in the pipeline is saved in the node itself which makes building, debugging, and evaluating even the most advanced pipelines simple and intuitive.

Creating custom nodes

Plugin nodes can easily be created using python or MATLAB, with full debugging support in external IDEs (Python) or in MATLAB. The user can do all image handling including pre- and post-processing and visualization in MICE Toolkit and integrate plugins anywhere in the pipeline. Plugin nodes can be shared between collaborators and even shared publicly through our user forum.

Visualization

The image visualizer in MICE Toolkit provides state-of-the-art visualization of medical image data, with up to six simultaneous viewports. Each viewport can show either 2D image projections or a 3D surface rendering, and viewport coordinate systems can be synchronized between viewports. The visualizer also provides tools for defining regions of interest that can be used in the pipeline or saved to a database and used at a later point in the analysis process.

Analysis in batches

Many analysis workflows are intended for application on a larger cohort of patients or images. To facilitate easy processing of large amount of data we provide batch analysis of workflows in MICE Toolkit. This means that the workflow is applied to all images or patients that fulfil predefined criteria. The resulting images from a batch analysis can be visualized, saved to disk or to any database within MICE Toolkit; and numerical values can be exported to .csv or .xlsx.

.files for each instance and for the entire cohort, for further statistical analysis. Each workflow in the batch is saved to disk, which makes it easy to retrospectively run workflows for any patient or image individually to verify the results or for debugging.


Extract results

A broad range of different export options are available in MICE toolkit. Images can be written to disk in many different formats, saved to one or more MICE Toolkit databases, or exported to one or more DICOM nodes from any workflow. This allows users to send results to other clinical software and integrate MICE Toolkit analyses in the clinical pipeline for research purposes. Numerical values such as statistical information can be written to .csv or .xlsx files or to reports in .pdf format. Images can also be exported to all common image formats for presentation and publication purposes, including animated .gif files; and even exported to STL files used for 3D printing.