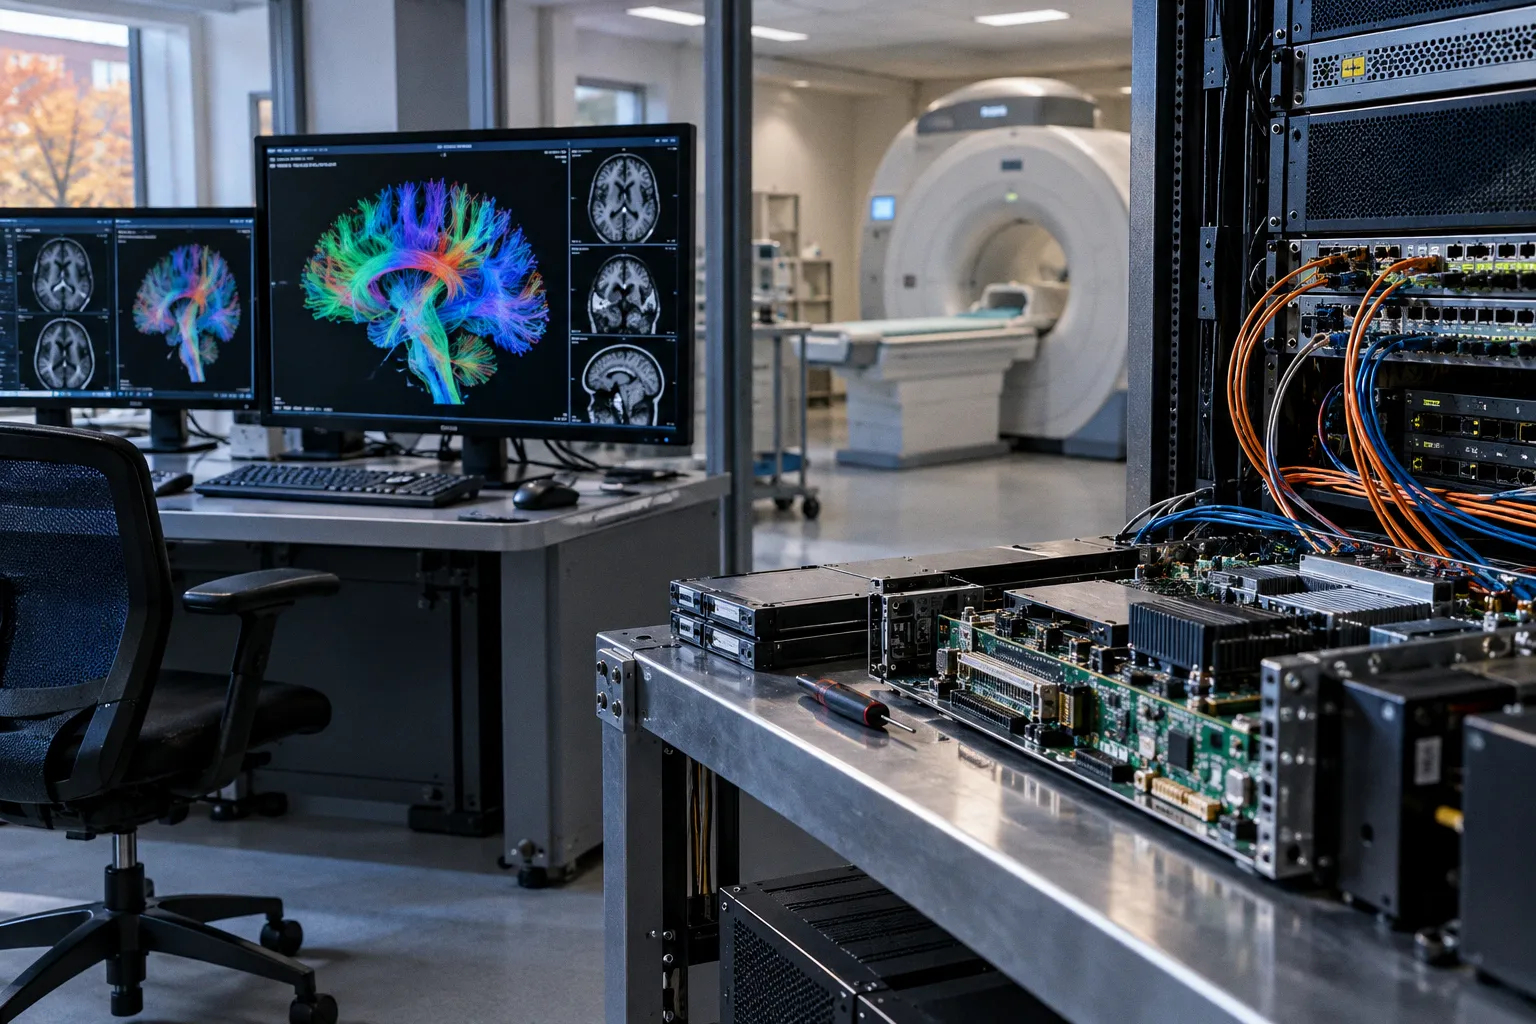
A new study published in Radiology draws a striking line between where patients live and how their brains appear on routine clinical scans. According to Diagnostic Imaging, researchers analyzing more than 2,800 brain MRI exams found that individuals residing in socioeconomically disadvantaged neighborhoods showed signs of accelerated brain aging and, on average, a 37% greater volume of white matter hyperintensities than those from less deprived areas. The work, which paired brain age gap metrics with geospatial deprivation indices, reframes the structural scan as something more than a diagnostic snapshot — it becomes a record of cumulative life experience, encoded in tissue.
What the Imaging Actually Shows
Consider the implications of what a "brain age gap" measurement really means at the console. The metric, derived from machine learning models trained on normative MRI data, estimates how much older a given brain looks compared with its chronological owner. When that gap widens, it reflects the subtle degradation of cortical thickness, ventricular expansion, and changes in white matter integrity that typically accumulate with age — except here they appear earlier, and more steeply, in patients whose neighborhoods carry higher deprivation scores. The 37% increase in white matter hyperintensity volume, the small bright foci that radiologists so often note almost in passing, takes on a different weight when read against a zip code rather than a clinical history. These are not incidental observations anymore; they are trajectories, and the trajectory is set long before the patient reaches the scanner bore.
This is why the methodological pairing matters so much. By anchoring brain age gap calculations to geospatial indices rather than relying solely on individual self-reported socioeconomic status, the authors have given neuroimaging researchers a way to think about population-level risk without abandoning the single-subject scan. It is a quiet but important shift: the same FLAIR and T1-weighted sequences already running through clinical pipelines can now feed models that contextualize risk in ways that no individual report ever could.
Why Neighborhood Context Matters for Neuroimaging
For those of us working at the intersection of MRI software and clinical practice, this kind of finding presses a familiar question with renewed urgency. Consider the implications for what a "normal" scan really is. If the reference population behind any brain age model underrepresents certain socioeconomic strata — and most do — then the model is quietly baking structural inequality into its baseline. The patient from a high-deprivation area will, by construction, look "older" against a standard that was never calibrated to their lived environment. This is not a flaw to be ashamed of; it is a known limitation of normative modeling, and it is exactly the kind of limitation that studies like this one help us see and begin to correct.
There is also a methodological lesson embedded here. Pairing imaging phenotypes with external social and environmental data requires pipeline architecture that most clinical software does not yet support out of the box. Researchers had to link geospatial deprivation indices, derived from census and address data, to imaging features extracted by automated segmentation tools. That kind of join is straightforward in a research environment and considerably harder in a routine PACS workflow, but the study makes a reasonable case that the effort is worth it. White matter hyperintensities, long treated as a nuisance variable in aging studies, may deserve more deliberate inclusion in reporting templates, especially when they cluster in ways that mirror social geography.
What to Watch Next
The clinical translation here will be gradual, and rightly so. One retrospective study of 2,800 exams does not yet justify changing how a radiologist dictates a report, but it does justify paying closer attention to where white matter hyperintensities fall on the age-expected curve for a given patient, and to whether the patient sitting in front of you carries a social history that might explain an unexpected gap. Over time, expect to see brain age gap outputs move from the research console into quality assurance dashboards, and eventually into structured reporting fields, particularly as regulatory frameworks begin to ask whether imaging software accounts for the populations it is deployed on.
The deeper lesson, perhaps, is that neuroimaging has always been a longitudinal science in disguise — every scan carries the ghost of every scan that came before it, and increasingly, the ghost of every environment the patient has lived within. Studies like this one remind us that the signal in the image is biological, but the meaning of the signal is biographical.